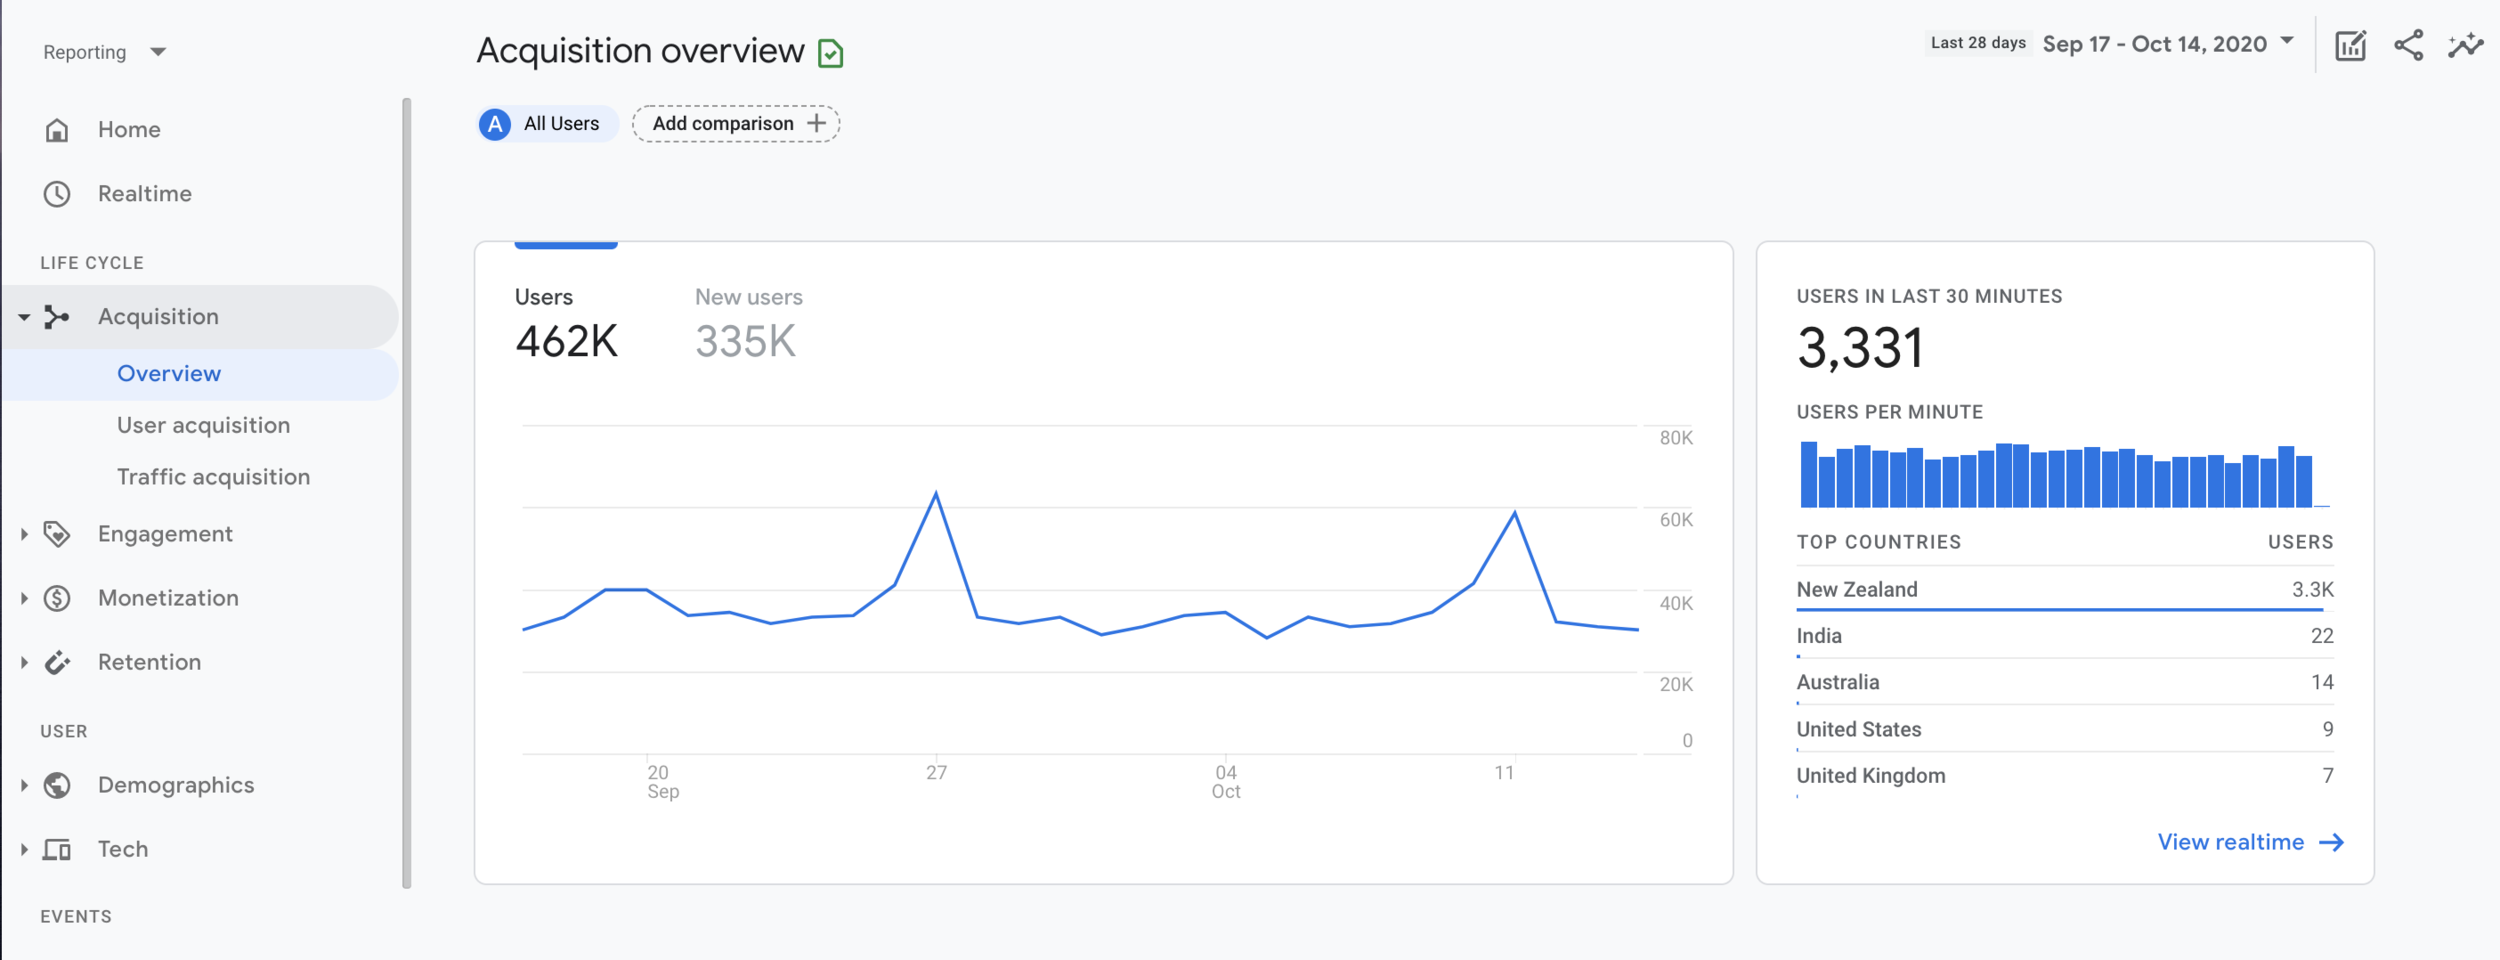
Google Analytics 4 (GA4) vs Universal Analytics

Google Analytics 4 is the latest and newest version of Google Analytics after Urchin, Classic and Universal.

Universal Analytics uses the concept of Users, Pageviews and Sessions, while GA4 uses the concept of Events.

Trackify have outlined some of the key differences between GA4 and Universal Analytics below.

Hits

Google Analytics 4 measurement is event based which means unlike Universal analytics, all interactions are an event:

google analytics 4 hits

Pageviews

Pageviews in Universal analytics translate to the page_view event in Google Analytics 4 properties. When you set up GA4, a page_view event is automatically triggered from the gtag.js snippet or the Google Analytics 4 Configuration Tag in GTM.

Sessions

GA4 session metrics are derived from the ‘session_start’ event which is automatically collected when a user engages in an app or website. The Session duration is calculated based on the time span between the first and last event in the session. This will no doubt lead to discrepancies between universal and GA4 metrics.

Events

Google Analytics 4 events fall into four categories:

  1. Automatically Collected - these are automatically logged from the gtag or gtm configuration

  2. Enhanced Measurement - these are a special set of events that can be enabled or disabled via the GA4 interface. Events include file_download, scroll and video_start.

  3. Recommended Events - these are events with predefined names and parameters that are recommended for different business types. These events require custom code changes.

  4. Custom Event - these are events that you name and implement yourself (similar to Universal analytics). These events also require custom code changes.

Dual Tracking Universal Analytics and Google Analytics 4

Trackify recommend setting up Dual Tracking to run both Universal and Google Analytics 4 at the same time to ensure you preserve historical data and take advantage of the new platform as soon as possible.

Note - because GA4 and Universal Analytics have different measurement concepts (as explained above) it is likely there will be variations between the data.

Google Analytics 4 has Landed

Today Google Analytics launched Google Analytics 4 - Google’s vision for the future of analytics.

Previously in beta and named ‘App+Web’, Google Analytics 4 is now the default for all new properties in Google Analytics. This is the 4th version of Google Analytics after Urchin, Classic and Universal:

Google Analytics 4 GA4

Here’s what you get from Google Analytics 4 (GA4):

  • Improved data controls for better management and control of data collection and retention

  • Automatically surfaced insights using machine learning

  • Cross platform reporting across web and mobile apps

  • Advanced analysis features

  • No hit limits

  • Unsampled reports

  • Big Query Integration

  • Deeper Google Ads integration

  • Lifecycle Reporting

  • Privacy centric design to align with industry changes such as ITP and GDPR

  • Works with or without cookies

  • Migration Tools

  • No ongoing costs - it’s free!

Trackify recommend setting up Dual Tracking to run both Universal and Google Analytics 4 at the same time to ensure you preserve historical data and take advantage of the new platform as soon as possible.

Find out more about Google Analytics 4 here or get in touch.

Using Google Analytics to Track a .cn China Website

Google Analytics Tracking in China

Google Analytics is Blocked in China - Myth or Truth?

It is true that most Google products are restricted in China due to the Great Firewall. The main used Search Engine in China is Baidu and they have their own Analytics product that they would prefer you use.

It also true that Google Analytics is blocked in China - well the web interface is anyway. But what if you are a business outside of China and you have a .cn website? Can you use Google Analytics to track your website behaviour and performance? The answer is YES!

Trackify were recently tasked with this exact problem. We have a New Zealand based client that have always relied on Google Analytics for tracking and measuring their website performance. They recently created a .cn version of their website to cater to their Chinese users living in China. Baidu Analytics was recommended for their tracking needs and they were under the impression they couldn’t use Google Analytics. While we’re sure Baidu Analytics is a great tool - it is in Chinese and not ideal for our English speaking client.

Trackify carried out some tests to see if Google Analytics would work on the .cn website. This is what we found:

  1. The Google Analytics Web Interface https://analytics.google.com is blocked if you are trying to access it when located in China. We recommend using a VPN if this is the case

  2. Adding Google Tag Manager Code to the .cn website (www.googletagmanager.com) significantly slowed the website down

  3. Universal Analytics code was not blocked or restricted for the .cn website

  4. Using Universal Analytics with DoubleClick Enabled slowed the .cn website down

In summary - Google Analytics does work on .cn websites but the Google Analytics interface can only be accessed outside of China (which is ideal for our client).

If you have a business outside of China and want to use Google Analytics to track your .cn website, Trackify recommend the following:

  1. Create a new Google Analytics Property and make note of the Property ID

  2. When configuring the new property DO NOT enable Remarketing or Audience reports as this will slow the website down

  3. Add the following snippet to the header of your .cn website with your new Property ID and use Tag Assistant or Real Time reports to test the data is coming through correctly

    <!-- Google Analytics -->
    <script>
    (function(i,s,o,g,r,a,m)
    {i['GoogleAnalyticsObject']=r;i[r]=i[r]||function(){
    (i[r].q=i[r].q||[]).push(arguments)},i[r].l=1*new Date();
    a=s.createElement(o),m=s.getElementsByTagName(o)[0];
    a.async=1;a.src=g;m.parentNode.insertBefore(a,m)
    })(window,document,'script','https://www.google-analytics.com/analytics.js','ga');
    
    ga('create', '{INSERT PROPERTY ID HERE}', 'auto');
    ga('send', 'pageview');
    </script>
    <!-- End Google Analytics -->

NOTE: There are risks associated with using Google Analytics in China - such as latency and data loss. There is no guarantee that the analytics.js script won’t be blocked in the future.

Tracking Data Studio Report Usage via Google Analytics

Did you know you can track your clients data studio report usage via Google Analytics?

Trackify recommend setting this up to see who is and isn’t using all those lovely dashboards you’ve set up!

To add tracking to your reports, follow the following steps:

Step 1

For this tracking we recommend setting up a new Google Analytics Account so you don’t risk skewing any existing data. Setup a new Google Analytics account here. We recommend excluding your personal IP address if you are responsible for building the dashboards. You can find out how to do this here.

Trackify recommend making the account name something recognisable such as ‘Data Studio Tracking’ and the website URL ‘https://datastudio.google.com’ as below:

Screen Shot 2018-10-31 at 3.38.34 PM.png

Step 2

Once your account has been created - make a note of your property ID under Property Settings.

Then go over to your Data Studio report in ‘Edit’ Mode and click File > Report Settings

Screen Shot 2018-10-31 at 3.41.57 PM.png

Enter your noted Property ID under ‘Google Analytics Tracking ID’

Screen Shot 2018-10-31 at 3.43.40 PM.png

Click out of settings and this change will be saved.

Step 3

Test your setup by changing to ‘View’ mode in your Data Studio Report and watching your data filter through into Google Analytics Real Time Reports. If you’ve already excluded your IP address this won’t work but you can still test using Google Tag Assistant.

Screen Shot 2018-10-31 at 3.52.45 PM.png

Step 4

As you can see above, the report URL is coming through as the page URL and the Report Name & Page Name is the Page Title.

I recommend having a standardised naming format for all of your Data Studio reports such as:

‘Client Name’ - ‘Report Name’

E.g. Auckland Barbers - Adwords Performance Report

This way you can easily create reports and filter by client name etc.

Step 5

Optional : Create a Data Studio report to see your top used Data Studio reports.

Here’s a free template designed by Trackify for you to use:

https://datastudio.google.com/open/1rvdMhSKFQR6mWZK6NfAVXh8LWQcl5q7m

Happy Tracking!

Google Analytics Cross Device Remarketing Explained

If you've logged into Google Analytics recently, chances are you've noticed this alert pop up in your account :

As of May 15th 2017 you will be able to take advantage of Google Analytic's new cross-device remarketing functionality. 

Google Analytics Remarketing

A remarketing audience is a list of cookies or mobile-advertising IDs that represents a group of users you want to re-engage because of their likelihood to convert. You create remarketing audiences based on user behavior on your site or app, and then use those audiences as the basis for remarketing campaigns in your ad accounts like AdWords and DoubleClick Bid Manager.

Currently Google Remarketing does not allow you to target across device and has historically relied on cookies and mobile IDs to identify users for remarketing lists. This is obviously not ideal as it's pretty normal behaviour for users to browse the web across multiple devices.  In fact, according to a study, '6 in 10 internet users start shopping on one device but continue or finish on a different one'.  

Currently, if a marketer built a remarketing audience in Google Analytics then they would only be able to reach them via browser cookies on a singular device.  Obviously this is not ideal and Google has noted that a solution is one of the top requested features.  For years marketers have been trying to find a work around for the problem.

Problem Solved

As of May 15th 2017 this problem will be solved.  Marketers will be able to reach users across devices similar to Facebook and Twitter.  As of May, if someone visits your website on one device, you can now reach them with more relevant ads when they search or browse on another device. By using signed-in user data, ads can be shown to visitors across any device which is linked to their Google account. 

"Google will use data from its signed-in users together with your Google Analytics data to build audience lists for cross-device remarketing. In order to support this feature, two things will happen:

First, for users on your site, Google Analytics will collect Google-authenticated identifiers associated with users’ Google Accounts (and therefore, personal information).

Second, Google Analytics will temporarily join these identifiers to your Google Analytics data in order to support your audiences."


What changes will I need to make?

Marketers should reconsider their remarketing strategy now that ads are going to be seen across multiple devices. 

To take advantage of these changes, ensure you have enabled remarketing in your Google Analytics account and made the relevant changes to your privacy policy:

Google Analytics Set Up & Configuration - 7 Basic Steps to Data Success

99% of clients that come to Trackify for an audit do not have trust in their Google Analytics data.  They're not convinced their data is accurate and tend to use the tool less than they could.  After carrying out hundreds of audits, Trackify have found that the main reason for inaccurate data is because Google Analytics hasn't been configured and set up correctly from the start.

In this blog post I am going to run through my top 6 basic recommendations for configuring and setting up a new Google Analytics Account.

1. Google Analytics Page Tracking Implementation

Before we actually get into the Google Analytics account, it's vital that Google Analytics is implemented correctly on all pages of your website.  If it's not implemented correctly, it's likely your metrics will be incorrect.  You can check this implementation using a free tool such as gachecker.  This tool will scan your site and identify which of your pages contain Google Analytics and more importantly - those that do not.  If you have pages that are missing Google Analytics, it's important you get this fixed ASAP to ensure your data and reporting is correct.

2. Rename your 'Default View'

On creation of an Account, Google Analytics will set up a 'view' of your data by default called 'All Web Site Data'.  You can find this under the admin section within Google Analytics:

I would recommend naming this view': '2. Unfiltered View' by clicking on 'View Settings' as below:

This will be your unfiltered 'raw' view which should not have any filters added to it.  This view will act as a backup in case anything you do in your main views messes up the data.

3. Create a 'Main View'

Next I would recommend creating a new view and calling it '1. Main View' by clicking 'Create New View':

This will be your main view where you will set up filters, goals, reports and dashboards.

When setting this new view up, ensure you do the following under 'View Settings':

  1. Name it '1. Main View'
  2. Check your reporting Time Zone is correct
  3. Check your Currency is correct
  4. Check your Website URL is correct
  5. Check you've ticked 'Exclude all hits from known bots and spiders'

4. Internal IP Filter Exclusion

This is such an important step that lots of companies tend to overlook.  I can't stress enough how important it is to remove internal IP addresses to ensure your data is not skewed.  This includes your office, your agencies, your development team and anyone else who may be accessing your website for internal reasons.

Find out how to create an IP Exclusion Filter here.

5. Goal Set Up

To get the most out of your Google Analytics Account, it is important to have goals set up in your Main View.

A Goal is a measure of success for your website and they can vary for different business types:

  • An eCommerce website could define success to be users making a purchase on their site
  • A Saas website could define success as users signing up for a free trial of their software on their site
  • A blog website could define success as users spending a certain amount of time on their site

All of these goals are measurable within Google Analytics but it is important to set them up under the 'Goals' section of your Main View as soon as possible:

6. Data Studio Dashboard

The Google Analytics interface can be very confusing to newbies without any training.  We recommend using a data studio dashboard to bring in all your key metrics into one place. Here are some templates you can use to get you started:

Trackify Ecommerce Dashboard

Trackify Audience Overview Dashboard

When using either dashboard ensure you change the data to the appropriate Google Analytics View:

Screenshot+2017-12-04+15.16.49.png


For more information on goals you can read Google's support page here or get in touch with Trackify for a free consultation.

I've had a play around with Google Data Studio beta...and it's good!

When I heard that Google was released a visualisation tool as part of its Analytics 360 suite, I wasn't surprised given how important reporting via a dashboard is to enterprise-level organisations.  With the beta being released only recently, I was excited to get my hands dirty and have a play with it.

Given it was initially (and as of July 12, still is) only to users in the US, I had to use a VPN (*cough*) to access the beta, allowing me to create 5 custom reports.

After about an hour, I've been very impressed with the tool and whilst there's some bugs, it's to be expected (given it's in beta).  Here are some highlights:

1.  A lot of data connectors possible (esp. via Google Sheets)

THE CURRENTLY SUPPORTED "OUT OF THE BOX" CONNECTORS ARE (NOT SURPRISINGLY) ALL GOOD PRODUCTS.

Whilst the default data connectors are only Google properties, this increases exponentially with Google Sheets given the vast sources of information you can import via Supermetrics plug-in.  Having all sources (e.g. cost data) in a single dashboard will ensure that important calculated metrics such as ROI will be easily calculated.

Once the product is released (also a part of the Google 360 suite, I'll also be interested to see what Attribution 360 data can be added.  Especially if it will be used to put data from other sources in context!  I'm a big believer in always putting figures and facts in context to assess whether its "performing or not".

2.  Connecting sources a breeze!

With other dashboards, I've (almost always) had issues with connected external data sets.

The process of actually connecting data sources couldn't have been easier (disclaimer: I've only connected Google Analytics data).  This is in relation to other third-party dashboard solutions where I've found it much more cumbersome to connect data sources.  It shouldn't be surprising given the connectors are all under the Google "eco-system".

The business implication here is that it makes creating dashboards much easier for anybody.  This is only good news for those that may not have the "technical" skills that may have been needed with other solutions.

3.  Ability to customise "look & feel" of dashboards are endless

My personal philosophy with dashboarding and reports is that it (along with being meaningful, of course!) must aesthetically look appealing.  It is my experience that reports that look great have more chance to have attention spent on it by your target audience (unless your target audience are finance people / accountant - in which case, just give them tables full of figures!)

Google Data Studio not only made customising the look & feel very easy - but the options that it gives is almost endless.  This is fantastic when analysts think about dashboard layout and strategy around meaningful information to report on and how (pie chart, table, line graph etc.) this information will be represented.

Dashboards that are meaningful and look great are gold!

Dashboards that are meaningful and look great are gold!

4.  In short, Google Data Studio is very promising!

As someone that loves creating reports and dashboards (nerd alert!), I've been very impressed with Google Data Studio.  

I'm going to hold off on calling it such things as a "game changer", but only because official pricing for the product has not been released yet!  The tool itself is fantastic, but given that it's part of the 360 suite, it will be price geared towards enterprise (i.e. cha ching!!! i.e. not cheap).  However, as a beta, it is certainly warranting itself as a tool that will justify a premium.

What do you think?  Have you had experience with Google Data Studio?  I'd love to hear of your experience and your thoughts!